REMARC 2026Review copy
Page 19
02
02 ElectricityREMARC 2026
Chapter 02

Electricity

From exporter to importer: how a weaker hydro year, rapid solar growth and a tightening system reshaped Romania’s power market in 2025, and where prices are heading to 2050.

  1. In this chapter
  2. Key facts20
  3. Generation mix by fuel21
  4. Installed capacity22
  5. Romania in the EU power mix23
  6. Wholesale price outlook to 205024
  7. Balancing & ancillary services25
  8. Monthly & daily wholesale prices26
  9. Hourly price heat map27
  10. Consumption & GDP28
  11. Net imports29
  12. Trade by neighbour30
Electricity19
Page 20
02
02 ElectricityREMARC 2026

Key facts
Electricity 2025

Four numbers that summarise Romania’s power market this year. Each one links to the page where the evidence sits.

Net electricity imports, 2025
4.5TWh

Romania shifted from electricity exporter to a structurally import-dependent market, the highest net imports in over three decades.

Net imports 2014–2025 (negative = net exports) · p. 29
Hydro generation, 2025 vs 2023
−32%

Hydropower decline constrained electricity supply despite continued renewable expansion.

Hydro generation, TWh · p. 21
Solar PV capacity, 2025 vs 2024
+80%

Solar capacity expanded rapidly, reshaping Romania’s electricity generation portfolio.

Installed solar PV, GW · p. 22
Day-ahead price forecast, 2050
€74/MWh

Wholesale prices moderate, but volatility increasingly rewards system flexibility and storage.
Day-ahead average, €/MWh · p. 24
Romanian Energy Market Annual Report20
Page 21
02
02 ElectricityREMARC 2026
Generation mix

Romania’s electricity mix became increasingly constrained after 2023, as declining hydropower outweighed solar generation and nuclear output.

Electricity generation by fuel type · GWh, 2022–2025

Fig. 2.1
Source: to be confirmed by CIGATotals shown above bars
  • Falling hydropower generation accounted for most of the nearly 8 TWh decline in total electricity production since 2023.
  • Stable nuclear generation cushioned the impact of weaker hydro conditions, maintaining around one-fifth of total electricity supply.
  • Growing solar PV partially compensated for lower hydro output, but its scale remained insufficient to offset losses.
  • Coal generation continued its downward trajectory, indicating gradual progress towards a lower-carbon electricity mix despite lower overall generation.
Electricity21
Page 22
02
02 ElectricityREMARC 2026
Installed capacity

Romania’s installed capacity reached a record 19.4 GW in 2025, driven by rapid solar expansion despite continued coal retirements.

Installed power generation capacity by technology · MW, 2022–2025

Fig. 2.2
Source: to be confirmed by CIGALine = total installed capacity
  • Total installed capacity increased by nearly 1.2 GW since 2023, reflecting sustained investment in new generation assets.
  • Solar PV capacity expanded by almost 1 GW between 2022 and 2025, becoming Romania’s fastest-growing generation technology.
  • Coal capacity declined by approximately 1.5 GW, accelerating the transition away from carbon-intensive electricity generation.
  • Hydro, nuclear and natural gas capacities remained broadly stable, providing system flexibility and security during the energy transition.
Romanian Energy Market Annual Report22
Page 23
02
02 ElectricityREMARC 2026
EU comparison

Romania maintains one of the EU’s most diversified electricity mixes, reducing reliance on any single generation technology.

Electricity mix by EU country · share of generation, 2025

Fig. 2.3
Source: OWID, EMBER
  • Low-carbon sources provide around 65% of Romania’s electricity, led by hydro, nuclear and wind.
  • Natural gas and coal together still account for roughly one-third of electricity generation, highlighting remaining decarbonisation challenges.
  • Romania’s electricity mix is more balanced than many EU peers, avoiding excessive dependence on either nuclear or fossil fuels.
  • Solar contributes a relatively modest share compared with southern European countries, indicating significant untapped expansion potential.
Electricity23
Page 24
02
02 ElectricityREMARC 2026
Price outlook to 2050

Romania’s electricity market is projected to deliver structurally lower wholesale prices by 2050, despite persistent inflationary pressures.

Electricity market indices vs inflation · index, 2025 = 1.00

Fig. 2.4
Source: to be confirmed by CIGADAM = day-ahead market · BM = balancing market

Day-ahead and balancing price forecast · €/MWh, 2025–2050

Fig. 2.5
Source: to be confirmed by CIGATime axis to scale
  • Day-ahead market prices are projected to decline nearly 40%, from around €118/MWh to €74/MWh by 2050.
  • Balancing market prices remain increasingly volatile, with surplus prices falling to around 0.5× 2025 levels by 2050.
  • Inflation is forecast to increase by approximately 65% by 2050, outpacing electricity price growth over the period.
  • The widening gap between deficit and surplus balancing prices signals stronger incentives for flexibility and energy storage investments.
Romanian Energy Market Annual Report24
Page 25
02
02 ElectricityREMARC 2026
Balancing & ancillary services

Romania’s balancing and ancillary service markets are projected to become more cost-efficient while increasingly rewarding system flexibility by 2050.

Balancing market bid price forecast · €/MWh, 2025–2050

Fig. 2.6
Source: to be confirmed by CIGA

Ancillary services reservation fee forecast · €/MWh, 2025–2050

Fig. 2.7
Source: to be confirmed by CIGA
  • aFRR reservation fees are projected to halve by 2030, stabilising near €7/MWh thereafter.
  • mFRR reservation fees decline steadily, reducing ancillary service procurement costs by roughly 50% over the forecast period.
  • aFRR bid prices fall from approximately €180/MWh to €65/MWh, reflecting lower balancing costs.
  • mFRR bid prices nearly triple to around €100/MWh, indicating growing value for slower balancing services by 2050.
Electricity25
Page 26
02
02 ElectricityREMARC 2026
Wholesale prices

Romanian wholesale electricity prices moderated in 2025, although pronounced seasonal and intraday volatility continued to shape market dynamics.

Monthly wholesale electricity prices · €/MWh, 2024–2025

Fig. 2.8
Source: to be confirmed by CIGA

Average daily profile of wholesale prices · €/MWh by hour, 2025 – May 2026

Fig. 2.9
Source: to be confirmed by CIGA
  • Monthly wholesale prices declined from nearly €160/MWh in February to below €90/MWh by late spring 2025.
  • Evening price peaks consistently exceeded €850/MWh, highlighting persistent ramping needs during high-demand hours.
  • Compared with 2025, early-2026 prices shifted towards earlier evening peaks, reflecting changing demand and renewable generation patterns.
  • Wholesale prices recovered above €120/MWh during autumn 2025, underlining the strong seasonal influence on electricity markets.
Romanian Energy Market Annual Report26
Page 27
02
02 ElectricityREMARC 2026
Price patterns

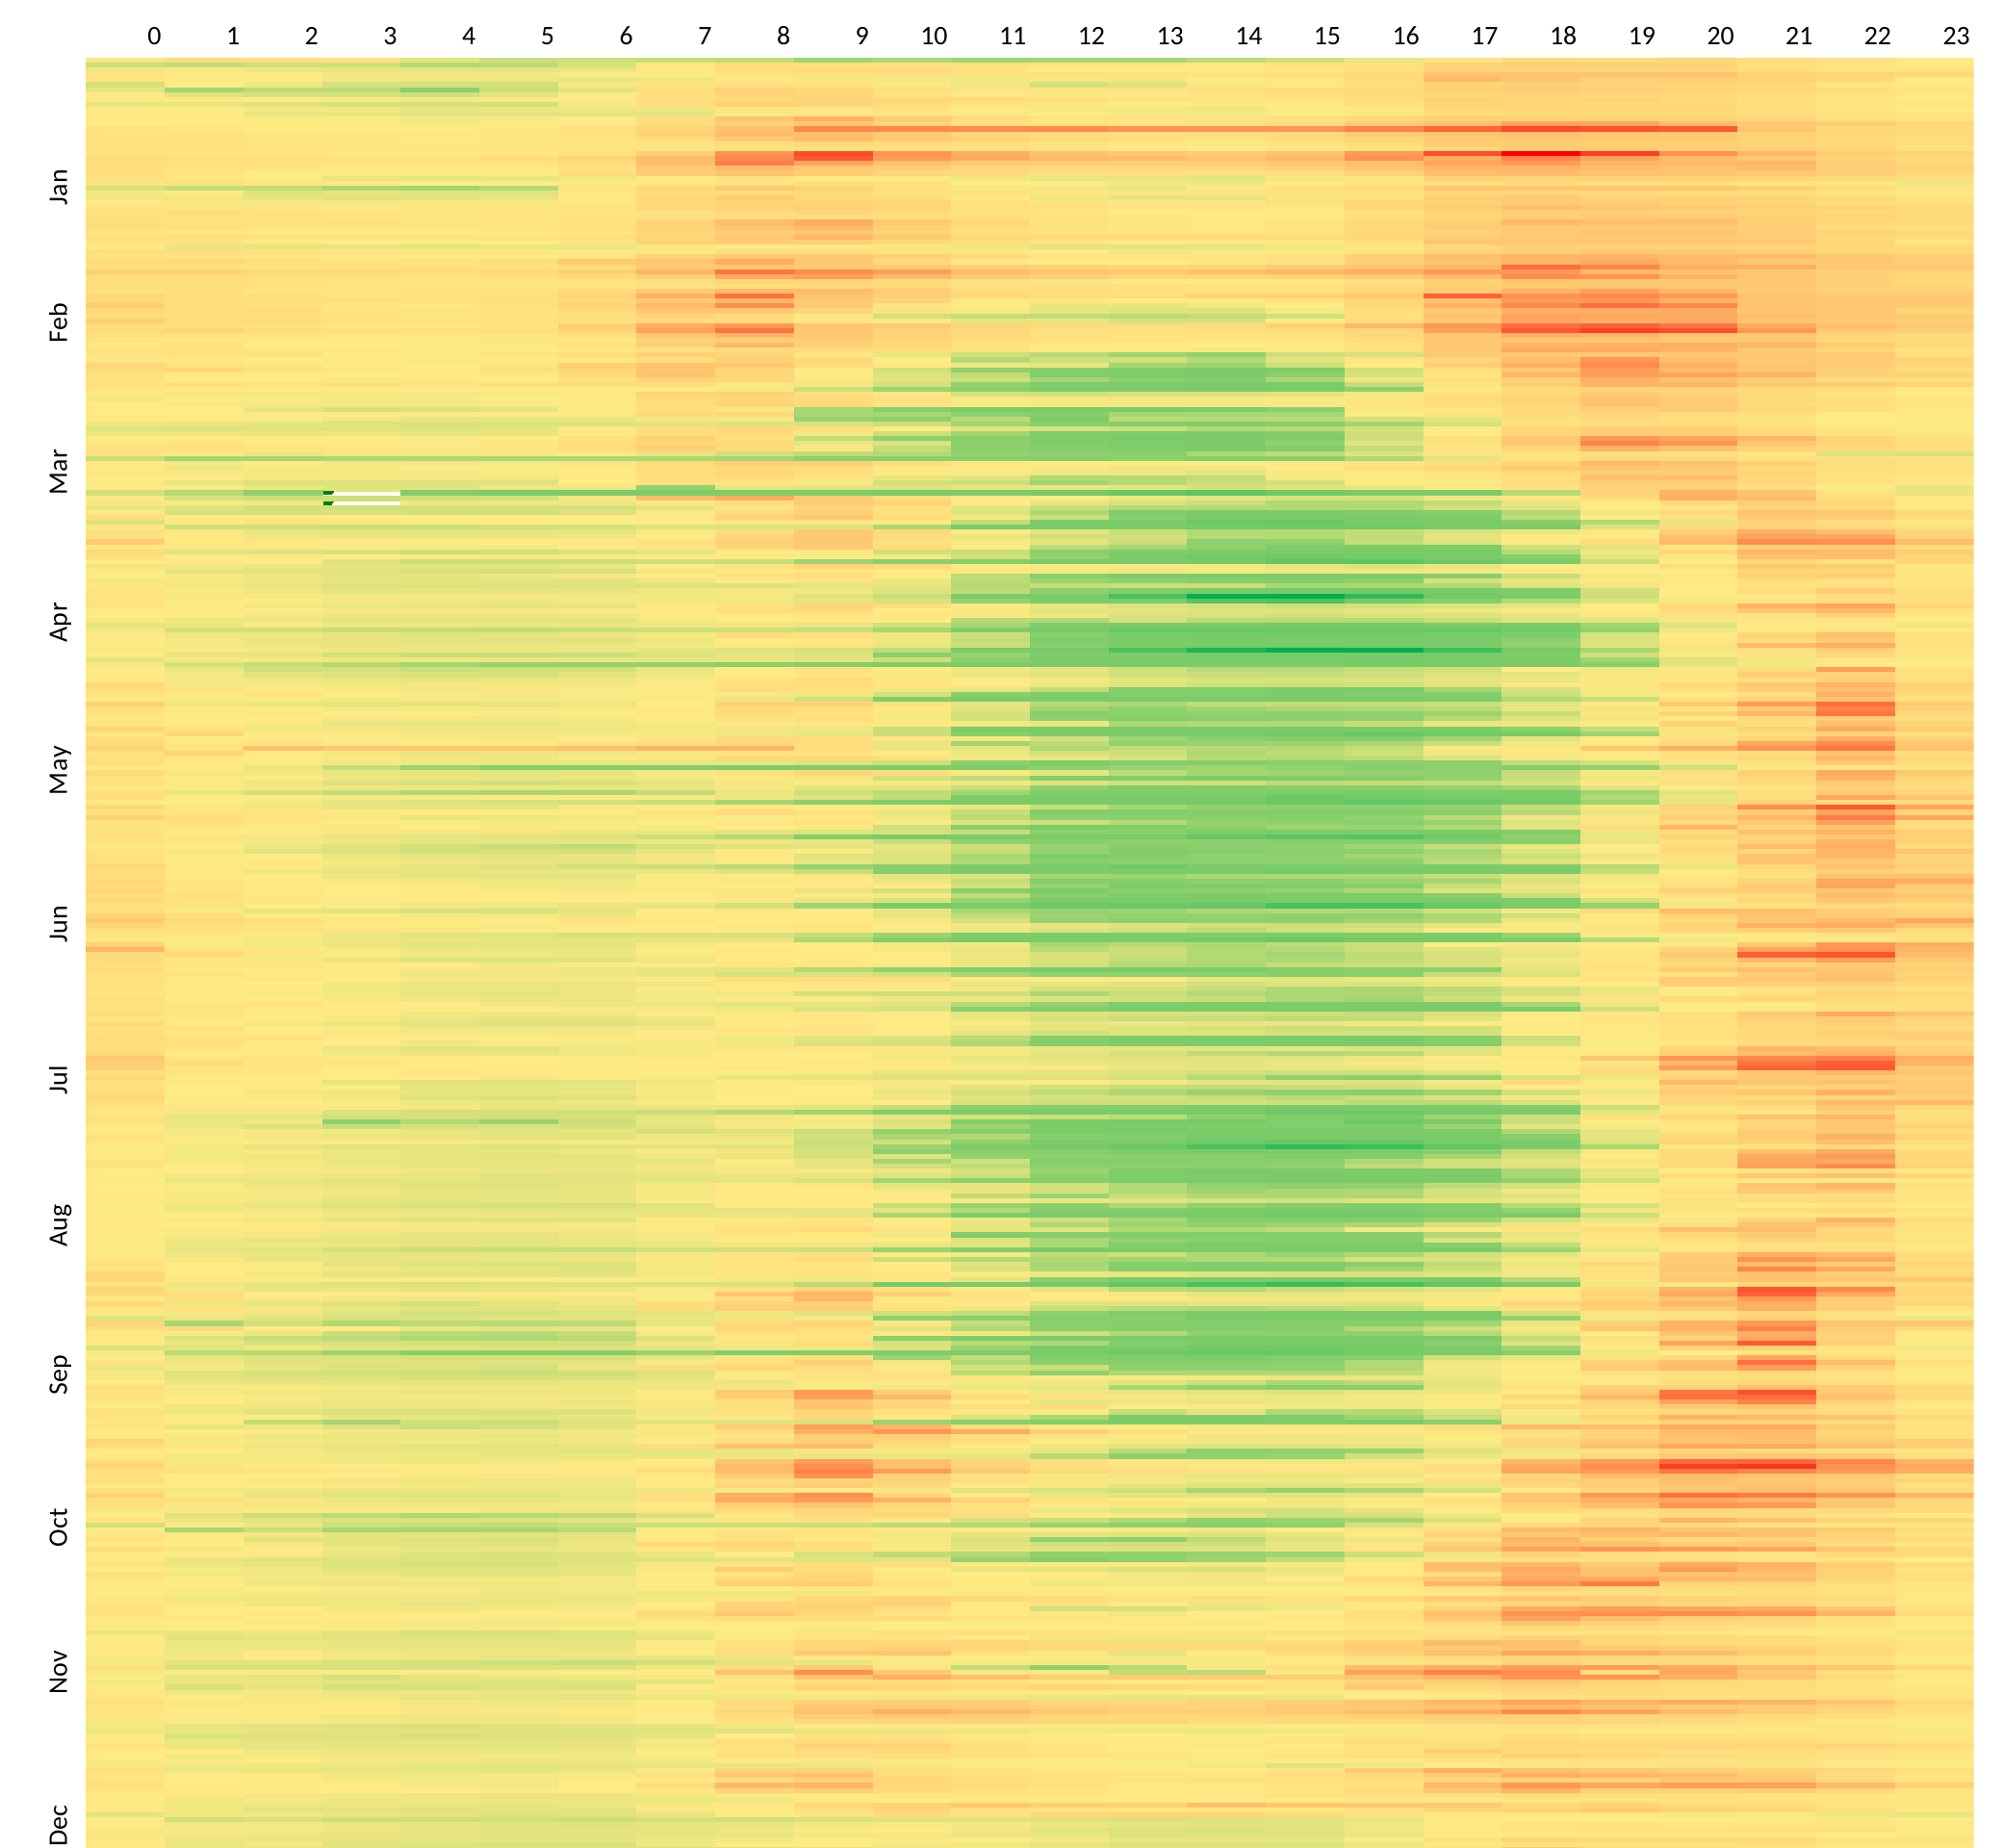
Romania’s wholesale electricity prices followed a pronounced pattern, reflecting renewable generation variability and evening demand peaks.

Wholesale electricity prices by hour and month · €/MWh, 2025

Fig. 2.10
Source: to be confirmed by CIGA
  • Evening hours (18:00–21:00) recorded the highest prices throughout the year, reflecting peak demand and lower renewable output.
  • Price volatility intensified during autumn and winter, with more frequent high-price periods extending beyond evening peak hours.
Electricity27
Page 28
02
02 ElectricityREMARC 2026
Demand

Romania’s electricity demand has remained broadly stable while maintaining one of the EU’s lowest electricity intensities relative to economic output.

Electricity consumption in Romania · TWh, 2015–2025

Fig. 2.11
Source: to be confirmed by CIGA

Electricity consumption per unit of GDP, EU · TWh / bn PPS, 2023–2025

Fig. 2.12
Source: to be confirmed by CIGA
  • Electricity consumption recovered to 55.3 TWh in 2024, remaining below the 57.0 TWh peak recorded in 2022.
  • Demand has fluctuated within a narrow 52–57 TWh range since 2015, indicating a mature electricity market.
  • Romania ranks among the EU’s least electricity-intensive economies, consuming around 0.09 TWh/billion PPS in 2025.
  • Electricity consumption per unit of GDP remained broadly stable between 2023 and 2025, suggesting modest efficiency improvements.
Romanian Energy Market Annual Report28
Page 29
02
02 ElectricityREMARC 2026
Cross-border trade

Romania has shifted from a long-standing net electricity exporter to a structurally import-dependent market in recent years.

Net electricity imports · TWh, 1990–2025 · negative = net exports

Fig. 2.13
Source: to be confirmed by CIGAOrange = net imports · lavender = net exports
  • Net electricity imports reached approximately 4.5 TWh in 2025, the highest level in over three decades.
  • Romania remained a net exporter for most of 1999–2019, with exports peaking near 7 TWh in 2014.
  • The transition to net imports after 2020 reflects tightening domestic supply amid changing generation patterns.
  • Import dependency has increased markedly since 2023, highlighting growing reliance on regional electricity markets for security of supply.
Electricity29
Page 30
02
02 ElectricityREMARC 2026
Cross-border trade

Romania’s cross-border electricity trade remained concentrated, with Hungary and Bulgaria dominating bilateral exchanges.

Electricity imports and exports by neighbouring country · TWh, 2025 · imports shown as negative

Fig. 2.14
Source: to be confirmed by CIGA
  • Hungary was Romania’s largest electricity trading partner, recording the highest import and export volumes in 2025.
  • Romania imported around 6 TWh from Bulgaria, making it the country’s primary source of electricity imports.
  • Electricity trade with Serbia resulted in a net import position, reflecting regional supply dynamics in Southeast Europe.
  • Cross-border exchanges with Moldova and Ukraine remained limited, contributing only marginally to Romania’s overall electricity trade.
Romanian Energy Market Annual Report30